
“You might not believe it, but 2.5 quintillion data bytes were created daily in 2020 alone.”
Shocking, isn’t it?
Data is accumulating at an exponential rate, so it is becoming crucial for businesses to organize, analyze, and visualize it effectively to stay ahead of the curve in the digitally evolving world. Data has little value in the real world until it is visualized for interpretation and analysis.
However, businesses across the world are struggling with some of the biggest challenges like:
👉 How to visualize data effectively
👉 How to use visual elements with the right balance
👉 How to select the convenient visual metaphor to depict the data persuasively
👉 Which technologies are best to streamline the data visualization process
But if we still stuck to using trial and error to determine the best route, we would be lost in the sphere of these endless challenges. Hence, what matters the most is a simple yet effective solution.
So we decided to offer this tutorial to help familiarize you with Python Django and FusionCharts integration for visualizing data.
Sound interesting?
Let’s get started.
Table of Contents
What Are Charts?
“Charts are a leading indicator of fundamental analysis.” — John Murphy
A chart is a visual representation of data using text, symbols, and visuals. You can leverage charts to unveil the relationships, trends, and patterns in different data sets.
When visualizing data in a chart, you first need to determine what kind of data you want to interpret. Second, select the appropriate chart type and attributes to represent the data in a simple manner.
For example, a bar chart could demonstrate how sales of a certain ice cream flavor have changed over the last five years. The length of each bar represents the year’s sales.
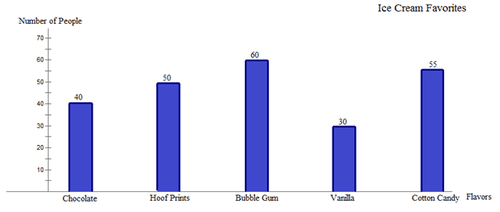
Source: Flexbooks
Important points to remember:
- Charts allow you to visually compare several sets of data.
- Charts help users better understand the information since the human brain processes images more quickly than blocks of text.
- A compelling graphic chart can help you express your point more persuasively and give your presentation more credibility.
Well, you understand how important charts are for your business.
How to Use FusionCharts
Before you start using FusionCharts, you must know what FusionCharts is.
FusionCharts is a JavaScript charting library used in building beautiful web and mobile dashboards with responsive and interactive charts, maps, and gauges. FusionCharts can be integrated with both front-end and back-end tech stacks.
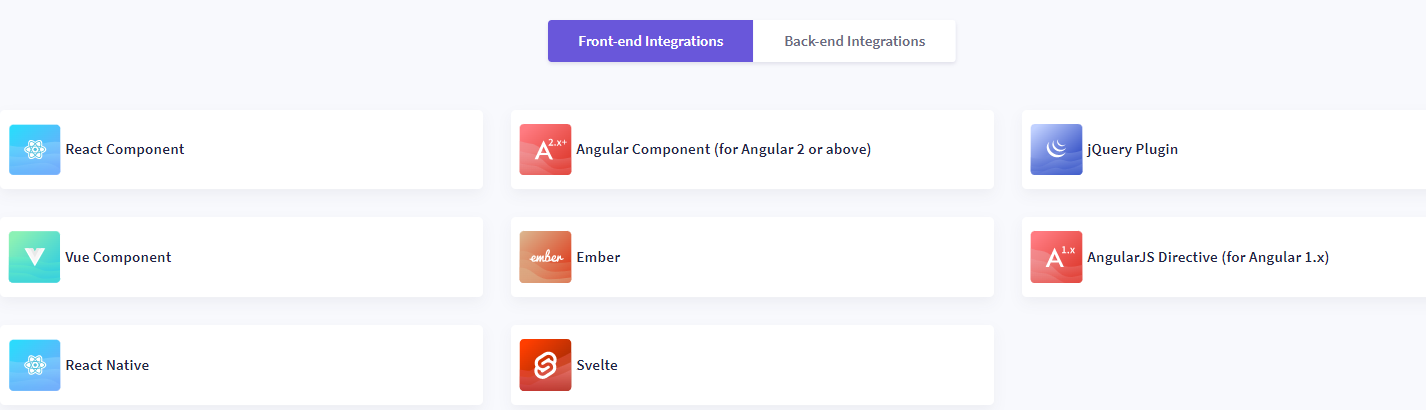
You can integrate FusionCharts with the front-end technologies illustrated below via the CDN or NPM package.
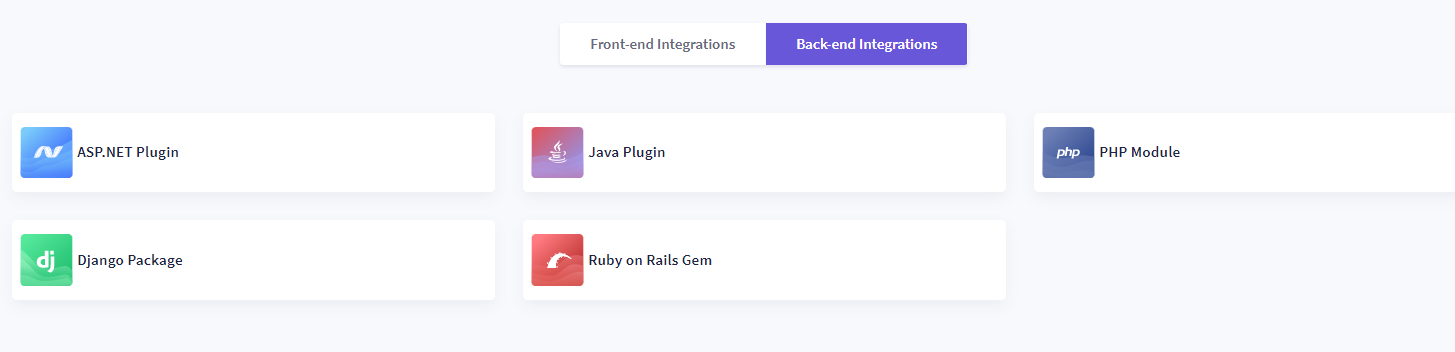
You can integrate FusionCharts with the back-end technologies illustrated below using the plugins.
And guess what? FusionCharts integrations are open source!
How to Use Python with FusionCharts to Build Beautiful Charts
Let’s dive right in to build beautiful charts for your dashboard.
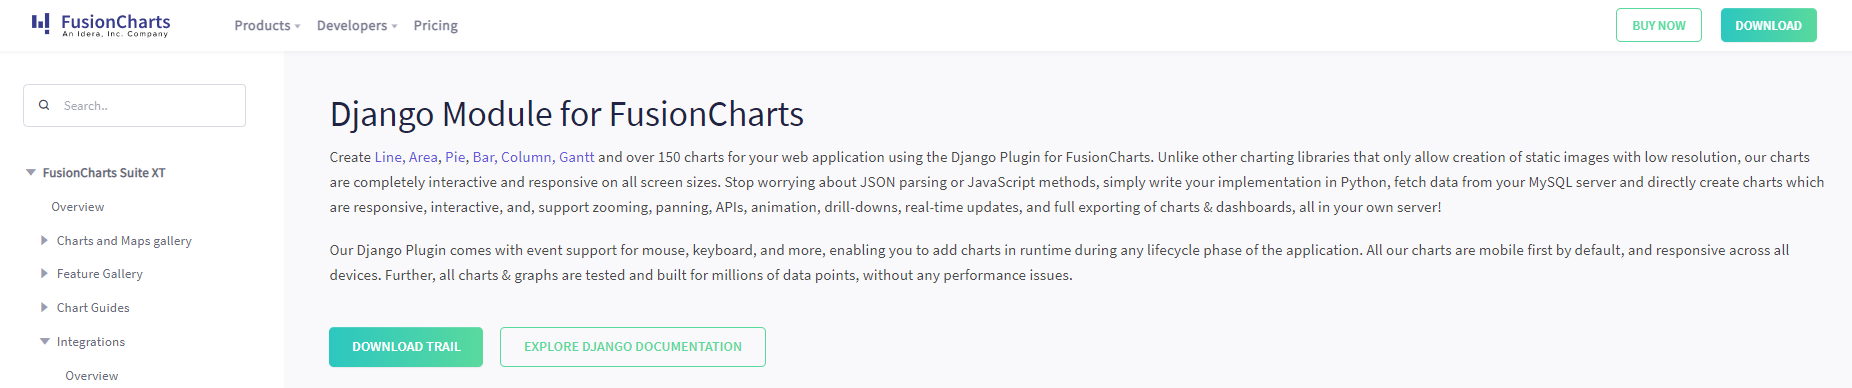
The Python Django plugin for FusionCharts allows you to create line, area, pie, bar, column, Gantt, and over 150 other charts for your online application. With this integration, you can build entirely interactive and responsive charts for all screen sizes, unlike other charting frameworks that allow the generation of only static images with low resolution.
You can stop worrying about JSON parsing and JavaScript methods; instead, write your implementation in Python, fetch data from your MySQL server, and create responsive, interactive charts that support zooming, panning, APIs, animation, drill-downs, real-time updates, and full chart and dashboard exporting, all on your own server.
The integration plugin allows you to add charts in runtime at any point in the application’s life cycle. In addition, all charts and graphs have been thoroughly tested and constructed to handle millions of data sets without causing any performance concerns.
Let’s have a quick demo to integrate FusionCharts with Python Django.
Step 1: Navigate to the Django Module for FusionCharts.
Step 2: Select the chart type you want to create for data visualization.

Step 3: Select a theme that you want to apply to your chart.

Step 4: Implement this codebase to integrate Python with FusionCharts.
| <!DOCTYPE html> <html> <head> <title>FC-python wrapper</title> <!– If you are using downloaded FusionCharts libraries, uncomment the below code –> <!– {% load static %} <script type=”text/javascript” src=”{% static “fusioncharts/fusioncharts.js” %}“></script> <script type=”text/javascript” src=”{% static “fusioncharts/themes/fusioncharts.theme.fusion.js” %}“></script> –> <script type=“text/javascript” src=“//cdn.fusioncharts.com/fusioncharts/latest/fusioncharts.js”></script> <script type=“text/javascript” src=“//cdn.fusioncharts.com/fusioncharts/latest/themes/fusioncharts.theme.fusion.js”></script> </head> <body style=“font-family:’Helvetica Neue’, Arial; font-size: 16px;”> <h3>{{ chartTitle|safe }}</h3> <div id=“chart-1”>{{ output|safe }}</div> <div id=“chart-2”>{{ output_2|safe }}</div> <br/> <a href=“/”>Back</a> </body> </html> |
Step 5: Implement this HTML codebase to render the charts.
| <!DOCTYPE html> <html> <head> <title>FC-python wrapper</title> <!– If you are using downloaded FusionCharts libraries, uncomment the below code –> <!– {% load static %} <script type=”text/javascript” src=”{% static “fusioncharts/fusioncharts.js” %}“></script> <script type=”text/javascript” src=”{% static “fusioncharts/themes/fusioncharts.theme.fusion.js” %}“></script> –> <script type=“text/javascript” src=“//cdn.fusioncharts.com/fusioncharts/latest/fusioncharts.js”></script> <script type=“text/javascript” src=“//cdn.fusioncharts.com/fusioncharts/latest/themes/fusioncharts.theme.fusion.js”></script> </head> <body style=“font-family:’Helvetica Neue’, Arial; font-size: 16px;”> <h3>{{ chartTitle|safe }}</h3> <div id=“chart-1”>{{ output|safe }}</div> <div id=“chart-2”>{{ output_2|safe }}</div> <br/> <a href=“/”>Back</a> </body> </html> |
You have successfully integrated Python with FusionCharts to build a beautiful chart for your dashboard.
How to Set Up FusionCharts Using Django
FusionCharts have built a simple Django wrapper. You can use this FusionCharts Django wrapper for adding beautiful and interactive charts to any Django project. You can generate charts in your browsers without creating any JavaScript code with the help of this wrapper.
Note: Python 2.7 or higher supports the FusionCharts Django wrapper.
Let’s see how to set up FusionCharts to render the chart using Django.
Prerequisite
Follow the steps below to initialize your Django app.
Step 1: Enter the following command in your terminal.
| django-admin startproject FusionChartsProject cd FusionChartsProject |
Step 2: Enter the following command to create a new Django app in the project directory.
| python manage.py startapp fusioncharts |
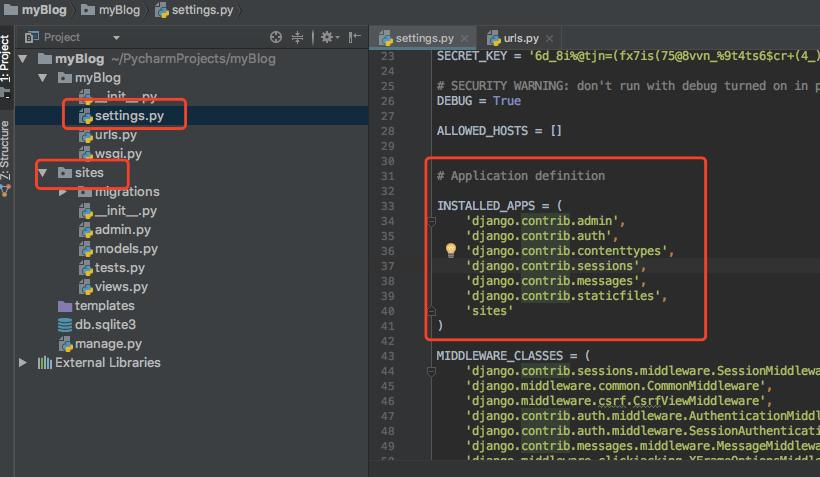
Step 3: Open setting.py and add the name of the Django app in the ‘INSTALLED_APPS’.
Install wrapper and dependencies
Follow the steps below to install the FusionCharts Django wrapper and other project dependencies.
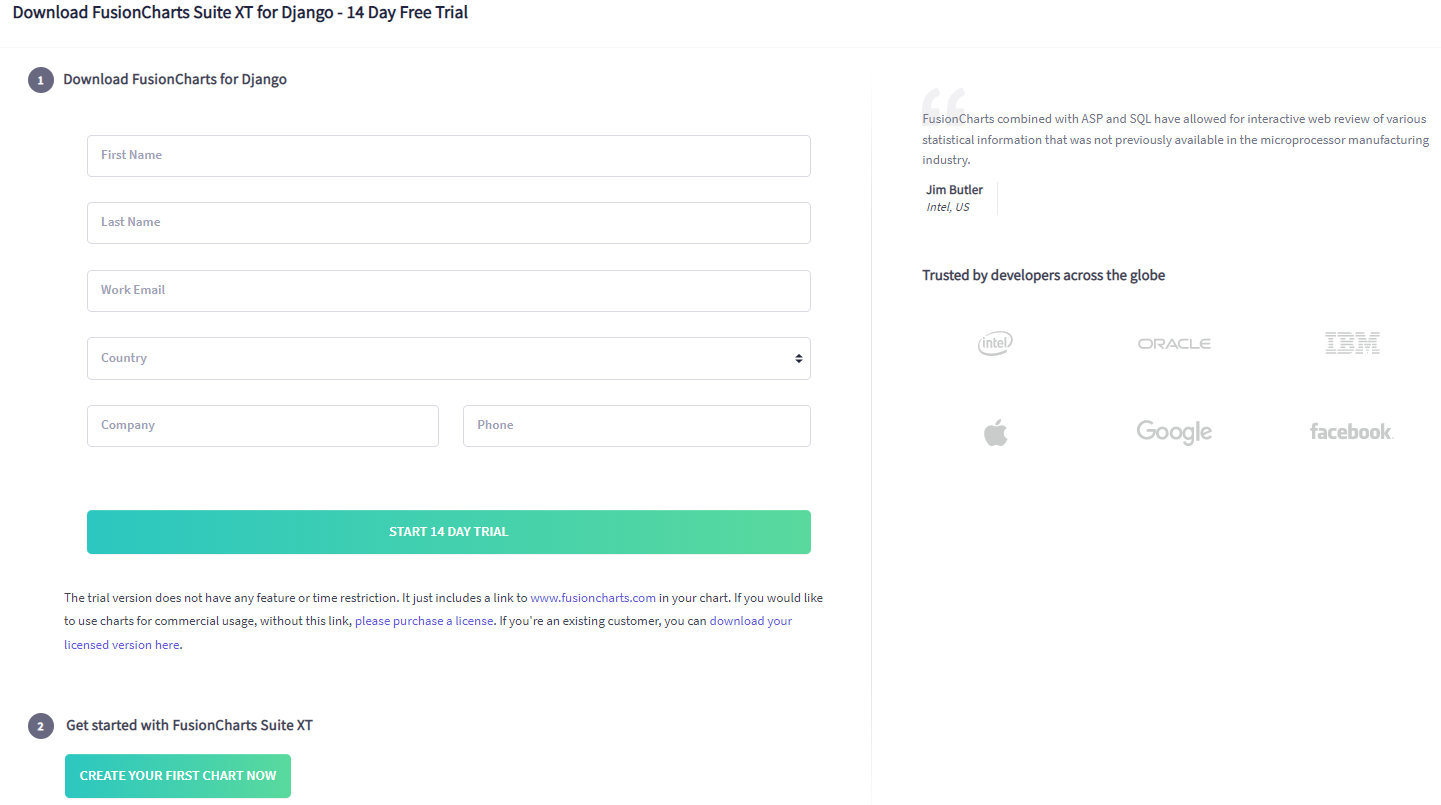
Step 1: Download the FusionCharts library to access the django-fusioncharts wrapper.
Once you have downloaded the fusioncharts library, follow the steps below to add Fusioncharts JavaScript files and django-fusioncharts wrapper to your application.
Step 2: Copy the fusioncharts.py file from the FusionCharts library you have downloaded and paste it into the FusionCharts app directory.
Follow the directory path to find the file Integrations > django > fusioncharts-wrapper.
Step 3: Create a static folder with the same name as the app (fusioncharts) within the fusioncharts (app) directory.
Step 4: Copy all of the Javascript files from the downloaded FusionCharts library into the static>fusioncharts directory.
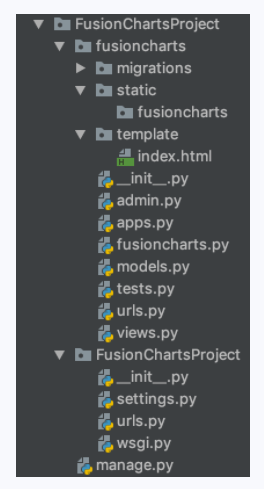
Step 5: Create a templates folder in the fusioncharts (app) directory.
Your directory structure should look like this:
Note: FusionCharts accepts data only in JSON format.
Configure chart
Once you have installed all the project dependencies, follow the steps below to start configuring the chart.
Step 1: Enter the command shown below to create a directory in the views.py file to store all of the values, which will be subsequently converted into a JSON object.
| // Preparing the chart data dataSource = OrderedDict() dataSource[“data”] = [] # The data for the chart should be in an array wherein each element of the array is a JSON object having the `label` and `value` as keys. dataSource[“data”].append({“label”: ‘Venezuela’, “value”: ‘290’}) dataSource[“data”].append({“label”: ‘Saudi’, “value”: ‘290’}) dataSource[“data”].append({“label”: ‘Canada’, “value”: ‘180’}) dataSource[“data”].append({“label”: ‘Iran’, “value”: ‘140’}) dataSource[“data”].append({“label”: ‘Russia’, “value”: ‘115’}) dataSource[“data”].append({“label”: ‘Russia’, “value”: ‘115’}) dataSource[“data”].append({“label”: ‘UAE’, “value”: ‘100’}) dataSource[“data”].append({“label”: ‘US’, “value”: ’30’}) dataSource[“data”].append({“label”: ‘China’, “value”: ’30’}) |
Step 2: Enter the command shown below to create an index.html file within the templates folder for creating a container for the chart.
| <!DOCTYPE html> <html> <head> <title>FC-python wrapper</title> {% load static %} <script type=”text/javascript” src=”{% static “fusioncharts/fusioncharts.js” %}”></script> <script type=”text/javascript” src=”{% static “fusioncharts/fusioncharts.charts.js” %}”></script> <script type=”text/javascript” src=”{% static “fusioncharts/themes/fusioncharts.theme.fusion.js” %}”></script> </head> <body> <div id=”myFirstchart-container”>{{ output|safe }}</div> </body> </html> |
Step 3: Refer to the command shown below to update the path of static files and templates in settings.py.
| ‘DIRS’: [‘FusionChartsProject/fusioncharts/templates’], |
Step 4: Refer to the command shown below to create a new variable as STATIC_ROOT and update the location of static files.
| STATIC_ROOT = “FusionChartsProject/fusioncharts/static”; |
Step 5: Run the command shown below to fetch the static files and move them into the
STATICFILE_STORAGE defined in STATIC_ROOT.
| python manage.py collectstatic |
You have successfully configured FusionCharts using Django.
How to Create Your First Chart Using the Django Module
A 2-D chart compares numerous items or displays changes in a data series over time. To track changes over time, item types are displayed horizontally while data values are presented vertically.
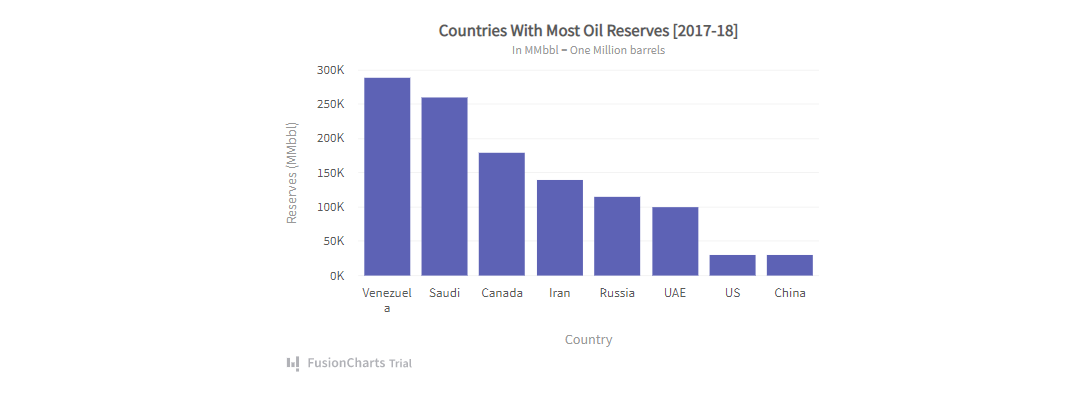
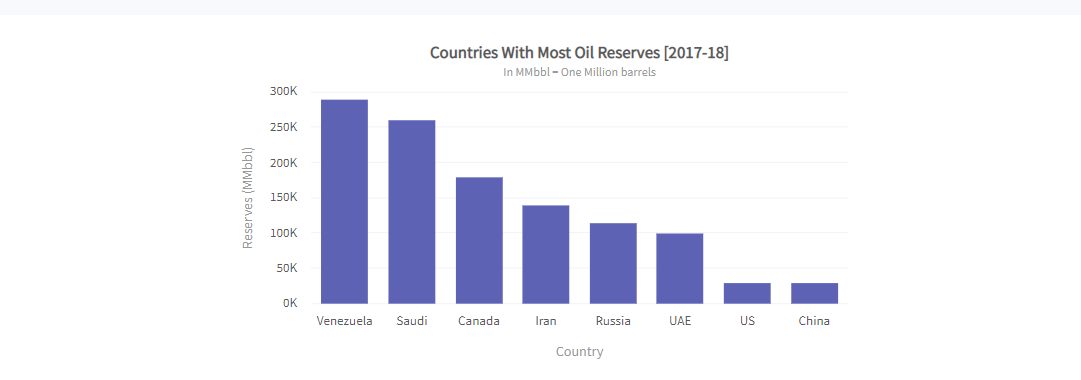
Let’s build your first 2-D chart using the django-fusioncharts wrapper to display countries with most of the oil reserves.
Here, the data in tabular form is showing the countries with the most oil reserves.
| Country | No. of Oil Reserves |
| Venezuela | 290K |
| Saudi | 260K |
| Canada | 180K |
| Iran | 140K |
| Russia | 115K |
| UAE | 100K |
| US | 30K |
| China | 30K |
Source: FusionCharts
Follow the steps below to build a 2-D chart using Django Module.
Step 1: Add the command shown below in the view.py file.
Note: The view.py would store the chart constructor, attributes, and the data source needed to render the chart.
| from django.shortcuts import render from django.http import HttpResponse from collections import OrderedDict # Include the `fusioncharts.py` file that contains functions to embed the charts. from .fusioncharts import FusionCharts def myFirstChart(request): # Chart data is passed to the `dataSource` parameter, like a dictionary in the form of key-value pairs. dataSource = OrderedDict() # The `chartConfig` dict contains key-value pairs of data for chart attribute chartConfig = OrderedDict() chartConfig[“caption”] = “Countries With Most Oil Reserves [2017-18]” chartConfig[“subCaption”] = “In MMbbl = One Million barrels” chartConfig[“xAxisName”] = “Country” chartConfig[“yAxisName”] = “Reserves (MMbbl)” chartConfig[“numberSuffix”] = “K” chartConfig[“theme”] = “fusion” dataSource[“chart”] = chartConfig dataSource[“data”] = [] # The data for the chart should be in an array wherein each element of the array is a JSON object having the `label` and `value` as keys. # Insert the data into the `dataSource[‘data’]` list. dataSource[“data”].append({“label”: ‘Venezuela’, “value”: ‘290’}) dataSource[“data”].append({“label”: ‘Saudi’, “value”: ‘290’}) dataSource[“data”].append({“label”: ‘Canada’, “value”: ‘180’}) dataSource[“data”].append({“label”: ‘Iran’, “value”: ‘140’}) dataSource[“data”].append({“label”: ‘Russia’, “value”: ‘115’}) dataSource[“data”].append({“label”: ‘Russia’, “value”: ‘115’}) dataSource[“data”].append({“label”: ‘UAE’, “value”: ‘100’}) dataSource[“data”].append({“label”: ‘US’, “value”: ’30’}) dataSource[“data”].append({“label”: ‘China’, “value”: ’30’}) # Create an object for the column 2D chart using the FusionCharts class constructor # The chart data is passed to the `dataSource` parameter. column2D = FusionCharts(“column2d”, “myFirstChart”, “600”, “400”, “myFirstchart-container”, “json”, dataSource) return render(request, ‘index.html’, { ‘output’: column2D.render() }) |
Step 2: Create a new file urls.py in the fusioncharts directory and run the command to automatically render the chart using URL.
| from django.contrib import admin from django.urls import path from . import viewsurlpatterns = [ path(”, views.myFirstChart , name=”demo”), ] |
Step 3: Add the path that will point to urls.py for fusionchart in the url.py file of fusioncharts Project to integrate fusioncharts in the main project directory.
| from django.contrib import admin from django.urls import path, include urlpatterns = [ path(‘admin/’, admin.site.urls), path(”, include(‘fusioncharts.urls’)) ] |
Render chart
Now, it’s showtime!
Let’s render your chart on the dashboard.
Run the command shown below to render the chart in the index.html container.
| python manage.py runserver |
As a result, the 2-D chart would render like this:
That’s it. Your first chart is ready.
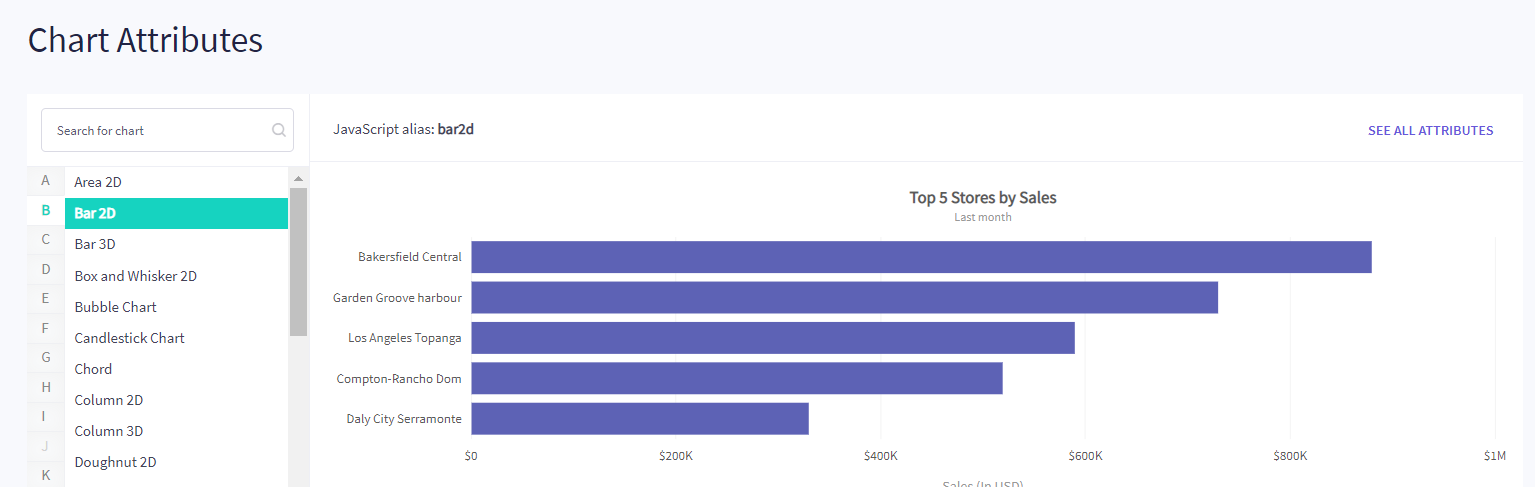
How to Create a Bar Chart Using FusionCharts
A bar chart is a graph that uses bars with heights or lengths proportional to the values they represent to convey categorical data. The bars can be plotted either horizontally or vertically.
Let’s create a 2-D bar chart.
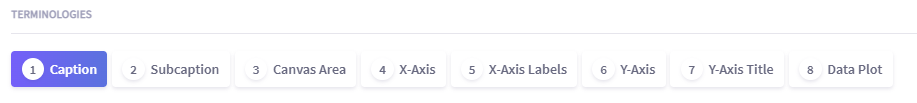
Step 1: Select the required terminologies to add to your chart.
Step 2: In the JSON data, enter the attributes and their corresponding values in this format “<attributeName>”: “<value>”.
| { “label”: “Feb”, “value”: “810000” }, |
Step 3: Set the chart type to bar 2D using the type attribute.
Step 4: Set the container object using renderAt attribute.
| renderAt: ‘chart-container’, |
Step 5: Specify the chart dimension using width and height attributes.
| width: ‘680’, height: ‘390’, |
Step 6: Set the type of data format using dataFormat attribute.
| dataFormat: ‘json’, |
Step 7: Based on the specified data format, set the dataSource attribute to fetch the data in a similar format.
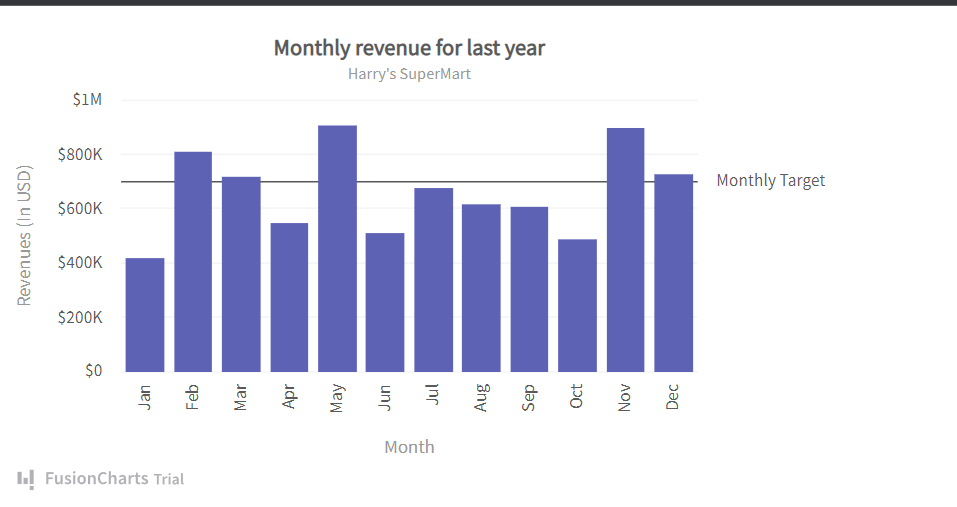
| dataSource: { “chart”: { “caption”: “Monthly revenue for last year”, “subCaption”: “Harry’s SuperMart”, “xAxisName”: “Month”, “yAxisName”: “Revenues (In USD)”, “numberPrefix”: “$”, “theme”: “fusion” }, “data”: [{ “label”: “Jan”, “value”: “420000” }, { “label”: “Feb”, “value”: “810000” }, { “label”: “Mar”, “value”: “720000” }, { “label”: “Apr”, “value”: “550000” }, { “label”: “May”, “value”: “910000” }, { “label”: “Jun”, “value”: “510000” }, { “label”: “Jul”, “value”: “680000” }, { “label”: “Aug”, “value”: “620000” }, { “label”: “Sep”, “value”: “610000” }, { “label”: “Oct”, “value”: “490000” }, { “label”: “Nov”, “value”: “900000” }, { “label”: “Dec”, “value”: “730000” } ], “trendlines”: [{ “line”: [{ “startvalue”: “700000”, “valueOnRight”: “1”, “displayvalue”: “Monthly Target” }] }] } }); |
Step 8: Specify a value of the data item within the data object using the value attribute.
| “value”: “510000” |
Step 9: Run the JSON command shown below to add data to your chart.
| { “chart”: { “caption”: “Monthly revenue for last year”, “subCaption”: “Harry’s SuperMart”, “xAxisName”: “Month”, “yAxisName”: “Revenues (In USD)”, “numberPrefix”: “$”, “theme”: “fusion” }, “data”: [ { “label”: “Jan”, “value”: “420000” }, { “label”: “Feb”, “value”: “810000” }, { “label”: “Mar”, “value”: “720000” }, { “label”: “Apr”, “value”: “550000” }, { “label”: “May”, “value”: “910000” }, { “label”: “Jun”, “value”: “510000” }, { “label”: “Jul”, “value”: “680000” }, { “label”: “Aug”, “value”: “620000” }, { “label”: “Sep”, “value”: “610000” }, { “label”: “Oct”, “value”: “490000” }, { “label”: “Nov”, “value”: “900000” }, { “label”: “Dec”, “value”: “730000” } ], “trendlines”: [ { “line”: [ { “startvalue”: “700000”, “valueOnRight”: “1”, “displayvalue”: “Monthly Target” } ] } ] } |
Step 10: Run the HTML command shown below to render your chart.
| <html> <head> <title>My first chart using FusionCharts Suite XT</title> <script type=”text/javascript” src=”https://cdn.fusioncharts.com/fusioncharts/latest/fusioncharts.js”></script> <script type=”text/javascript” src=”https://cdn.fusioncharts.com/fusioncharts/latest/themes/fusioncharts.theme.fusion.js”></script> <script type=”text/javascript”> FusionCharts.ready(function(){ var chartObj = new FusionCharts({ type: ‘column2d’, renderAt: ‘chart-container’, width: ‘680’, height: ‘390’, dataFormat: ‘json’, dataSource: { “chart”: { “caption”: “Monthly revenue for last year”, “subCaption”: “Harry’s SuperMart”, “xAxisName”: “Month”, “yAxisName”: “Revenues (In USD)”, “numberPrefix”: “$”, “theme”: “fusion” }, “data”: [{ “label”: “Jan”, “value”: “420000” }, { “label”: “Feb”, “value”: “810000” }, { “label”: “Mar”, “value”: “720000” }, { “label”: “Apr”, “value”: “550000” }, { “label”: “May”, “value”: “910000” }, { “label”: “Jun”, “value”: “510000” }, { “label”: “Jul”, “value”: “680000” }, { “label”: “Aug”, “value”: “620000” }, { “label”: “Sep”, “value”: “610000” }, { “label”: “Oct”, “value”: “490000” }, { “label”: “Nov”, “value”: “900000” }, { “label”: “Dec”, “value”: “730000” } ], “trendlines”: [{ “line”: [{ “startvalue”: “700000”, “valueOnRight”: “1”, “displayvalue”: “Monthly Target” }] }] } }); chartObj.render(); }); </script> </head> <body> <div id=”chart-container”>FusionCharts XT will load here!</div> </body> </html> |
You have successfully showcased your bar chart.
Wrap up
Data is a powerful wave!
Web development professionals are making the most out of data chunks by using charts to recognize trends, conduct analyses, make effective decisions, and achieve realistic goals. We hope you are excited to use this charting library to design robust, accessible, and user-friendly dashboards. Although there are a bunch of charting tools, none can beat FusionCharts’ integrations and features. Start exploring FusionCharts today with a 14-day free trial!