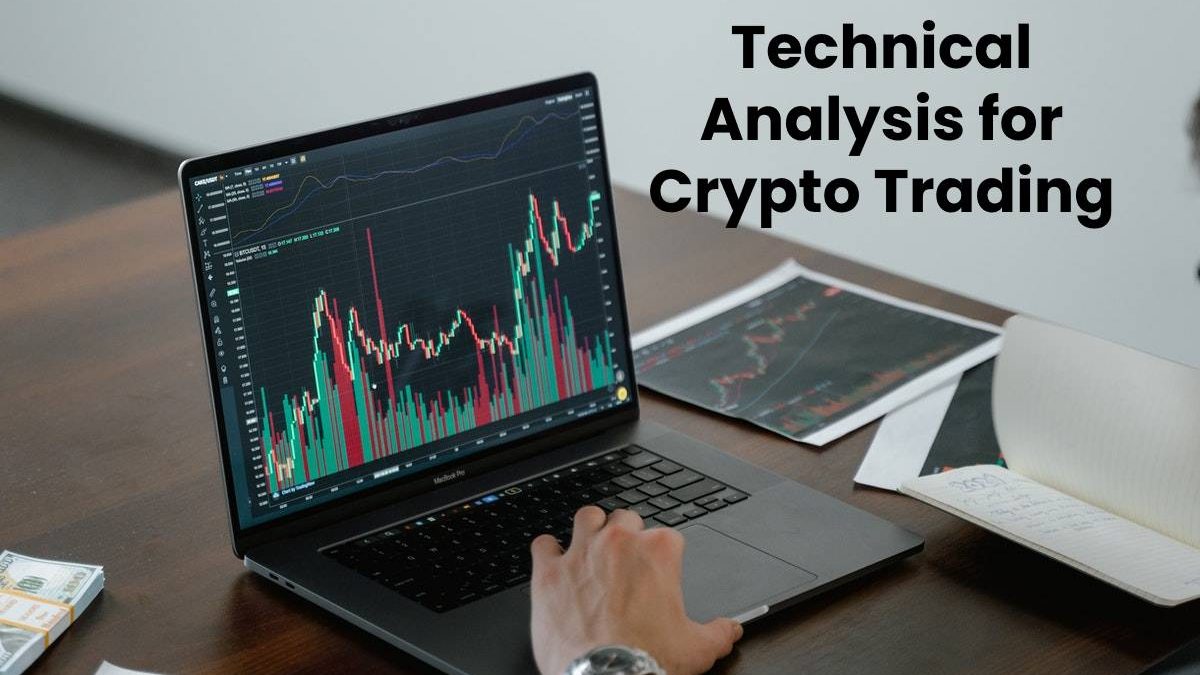


Look, crypto looks chaotic.
Charts going up. Down. Sideways. Sometimes all three in one day.
And if you’re just staring at price without context, it feels random.
But here’s the thing:
It’s not completely random.
There are patterns. Reactions. Repeated behavior.
That’s where technical analysis comes in.
Table of Contents
What Technical Analysis Actually Is (No Fancy Words)
At its core?
You’re reading charts to understand what traders are likely to do next.
Not predicting the future like magic.
Just… spotting probabilities.
You look at:
- price history
- volume
- patterns
And try to answer one question:
“Where is this most likely going next?”
That’s it.
Why Crypto Traders Rely on TA So Much
Honestly, crypto is perfect for technical analysis.
Why?
Because fundamentals are messy here.
Projects launch fast. Narratives change overnight. News pumps and dumps markets in minutes.
So instead of trying to track everything…
Traders look at the chart.
Because the chart already reflects everything:
- fear
- hype
- panic
- greed
It’s all there.
Before You Start: One Reality Check
TA doesn’t guarantee profit.
Let’s kill that myth early.
Even the best setups fail.
Sometimes badly.
What TA does is improve your odds—not eliminate risk.
Big difference.
The Most Important Concept First: Trend
If you ignore everything else—don’t ignore this.
Trend matters.
A lot.
There are only three types:
- Uptrend → higher highs, higher lows
- Downtrend → lower highs, lower lows
- Sideways → price stuck in a range
That’s it.
And here’s where beginners mess up:
They try to short an uptrend.
Or buy in a clear downtrend.
Bad idea.
You don’t fight the trend. You ride it.
Support and Resistance (This Is Where Things Click)
This is where charts start making sense.
Support = price level where buyers step in
Resistance = price level where sellers step in
Simple.
Example:
Bitcoin drops to $60,000 multiple times… and bounces.
That’s support.
It goes to $70,000… keeps getting rejected.
That’s resistance.
Now here’s the interesting part:
When resistance breaks? It often becomes support.
And vice versa.
Markets remember levels.
Weird. But true.
Indicator #1: RSI (Relative Strength Index)
RSI is one of the easiest tools to understand.
It tells you if something is overbought or oversold.
- Above 70 → overbought (price might drop)
- Below 30 → oversold (price might bounce)
Sounds simple.
And it is.
But don’t use it blindly.
Example:
If a coin is trending hard upward, RSI can stay above 70 for a long time.
That doesn’t mean “sell immediately.”
It means: be careful. Momentum is strong.
Indicator #2: Moving Averages (MA)
This one smooths out price noise.
Instead of looking at every candle, you see the average trend.
Common ones:
- 50-day MA
- 200-day MA
Here’s a classic signal:
When the 50 MA crosses above the 200 MA → bullish (golden cross)
When it crosses below → bearish (death cross)
Sounds dramatic. It kind of is.
But again—not perfect. Just useful.
Indicator #3: MACD (Momentum Indicator)
MACD looks confusing at first.
Lines crossing. Bars moving.
But here’s the simple version:
It shows momentum shifts.
When the MACD line crosses above the signal line → bullish
When it crosses below → bearish
It helps you catch trend changes early.
Not always perfectly. But often enough to matter.
Indicator #4: Volume (Most Underrated Tool)
Honestly?
Volume is more important than most indicators.
It tells you how strong a move actually is.
Price going up with high volume? → strong move
Price going up with low volume? → weak move
Same for drops.
If a breakout happens with no volume… it’s suspicious.
Like something that won’t last.
Putting It Together (Real Example)
Let’s say you’re looking at Ethereum.
You notice:
- Price bouncing off support at $3,000
- RSI around 35 (near oversold)
- Volume increasing
- MACD turning bullish
Now you’ve got confluence.
Multiple signals pointing in the same direction.
That’s what you want.
Not just one indicator screaming “buy.”
Common Mistakes Beginners Make
And yeah… you will make these.
Everyone does.
Overloading Indicators
Too many tools = confusion.
Stick to 2–3. That’s enough.
Ignoring the Trend
Trying to catch bottoms in a downtrend?
Risky. Very.
Trading Every Signal
Not every setup is worth taking.
Patience matters more than activity.
No Risk Management
This one hurts the most.
Even good traders lose money if they don’t manage risk.
Risk Management (Don’t Skip This)
You can be wrong. Often.
That’s normal.
What matters is how much you lose when you’re wrong.
Simple rules:
- Don’t risk more than 1–2% per trade
- Always use stop-loss
- Don’t go all-in
Survive first. Profit later.
TA vs Fundamental Analysis (Quick Reality)
Fundamental analysis = project value
Technical analysis = price behavior
You don’t have to pick one.
Many traders combine both.
But if you’re short-term trading?
TA usually matters more.
Glossary (Quick Terms You’ll See Everywhere)
- Bullish → expecting price to go up
- Bearish → expecting price to go down
- Breakout → price moves past resistance
- Pullback → temporary drop in an uptrend
- Liquidity → how easily assets can be bought/sold
Learn these. Saves time.
Tools You Can Use (Free + Paid)
Most traders use platforms like:
- TradingView (charts, indicators)
- Binance charts (basic but enough)
- CoinMarketCap (price tracking)
You don’t need expensive tools to start.
One Honest Truth Most Guides Won’t Tell You
You’ll lose trades.
A lot.
Even when everything looks perfect.
That’s part of it.
The goal isn’t to win every trade.
It’s to win more than you lose over time.
Final Thoughts
Technical analysis isn’t magic.
It won’t make you rich overnight.
But it gives structure to something that otherwise feels chaotic.
You stop guessing.
You start making decisions based on patterns, not emotions.
And yeah… that alone puts you ahead of most people in crypto.
Start simple.
Stay consistent.
And don’t try to master everything at once.
That’s where most people mess up.
This guide will set out how to go about using technical analysis when trading cryptocurrencies on Bitcoin Evolution